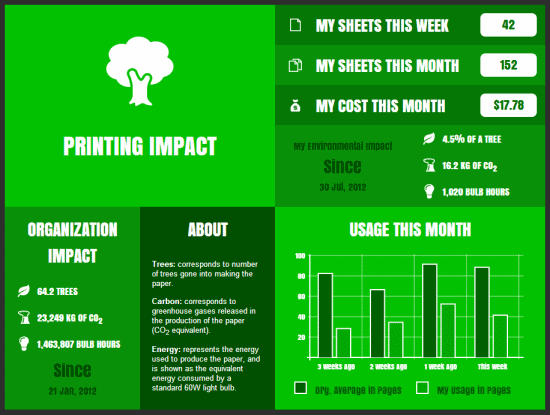
One of the most powerful features in PaperCut is not actually a feature at all - it’s the culture change that it brings about in an organization. Most of this change is encouraged by increasing the visibility of the impact printing has on the company and the environment. The Environmental Dashboard and the Windows Live Tile is an innovative way to raise awareness. It promotes paper saving in a positive and creative way. For example:
See your environmental impact front and center
Benchmark your usage against others in the organization
Reward and promote good user behaviour:
Award users for printing less
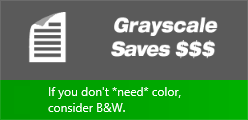
Encourage the user of duplex and grayscale
It makes printing impact tangible and understandable:
Converting sheets into an "energy equivalent"
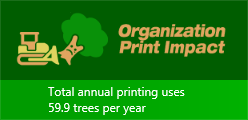
Emphasising forest conservation
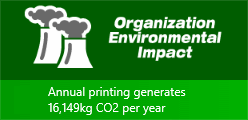
Highlighting CO2 emissions

The increasing use of devices running Windows with a tile based interface (featured in Windows 8 and above) has opened up a new avenue to communicate to users. The Environmental Dashboard page can be Pinned to the Windows Start Screen to create a dynamic Live Tile. This Live Tile will communicate over 20 user-specific facts, awards and challenges all generated from real-time PaperCut data.
All too often, the IT department is implementing back-end systems or invisible projects. The PaperCut Windows Live tile is a highly visible and positive story, and is a great complement to other changes planned in your print management program.
Tip
Recently PaperCut was working with a large national retail organization and they were in the middle of a project to implement PaperCut’s secure print release. There was push-back from various department heads worried that any barriers to printing were going to reduce productivity. The environmental impact statistics helped turn this reluctance around. In the end, the savings were so compelling the project’s success was promoted not only internally but externally as a strong corporate and social responsibility story... Oh, and for once the IT guy was the hero!
Some suggestions:
Encourage your users to bookmark their dashboard
Draw Windows users attention to the Live Tile and encourage them to Pin it to their start menu. See the section called “Windows Live Tile Installation”.
Link to the Environmental Dashboard on your intranet or monthly newsletter
Share environmental impact information visually with management
Challenge users to compare their live tile awards with their colleagues
Below is a small sample of the 20+ tiles available:


To pin the environmental live tile on the Windows Start Menu:
Go to the Start Menu (Press the Windows key).
Open Internet Explorer or Edge in the Start Menu. (NOTE: The browser must be configured as the default browser to complete the pinning process).
Enter the URL below (where
[server-name]is the hostname of your application server).http://[server-name]:9191/environmentaldashboard/Enter your network username/password. After successful login you will be taken to the Environmental Dashboard showing your usage statistics.
Press the favorites button.

For Internet Explorer, press the pin button.

For Edge, press menu button.

Press the Pin to Start button.

Press the Windows key to go back to the Start Screen. The Environmental Dashboard will now be pinned to the Start Screen. Clicking on the live tile will open the Environmental Dashboard.
After a short period the live tiles will start displaying. Five distinct live tiles will rotate displaying your environmental usage statistics, ratings, tips, etc. A new set of five tiles will be retrieved every 30 minutes.
Tip
Although Windows usually starts displaying the live tiles after a short delay, sometimes it takes a few minutes for them to activate. If the live tiles are not displaying, changing the tile size can kick it into action. To do this, right-click the tile, select the "Resize" option from the bottom and select a different size. Then change the size again back to the "Wide" tile format.
Important
The Environmental Dashboard will show user level environmental information by default. If you do not wish
user level information to be available, you can turn it off by unchecking the Show environmental
impact information checkbox found in the administration interface under
→ → . When this option is off, only organization wide environmental stats are shown in the live
tiles and dashboard.
Windows has very limited options to automatically deploy the live tile through the organization. We are hopeful that Microsoft will introduce improved tooling for this deployment in future versions.
Our current recommendation is to provide instructions to your users instructions on how to access the Environmental Dashboard and install the live tiles on Windows 8.1 and above. These instructions could be provided in an email or on the organization's intranet. The instructions should include information from the section called “Windows Live Tile Installation” and the section called “Using Environmental Dashboard on other browsers/platforms”.
The Environmental Dashboard displays interesting environmental impact and printing statistics for the user and organization. The Dashboard is is useful to all users and can be accessed using any web browser running on any platform.
The simplest way for to access the Environmental Dashboard is to open their web browser to:
Open a web browser to the following URL:
http://[server-name]:9191/environmentaldashboard/Enter their network username/password. After successful login you will be taken to the Environmental Dashboard showing your usage statistics.
Tip
An alternate way to access the dashboard is to open a browser to the following URL (replacing
[username] with their username):
http://[server-name]:9191/environment/dashboard/[username]/
This URL could be linked from the organization's intranet site if the user's username is known.